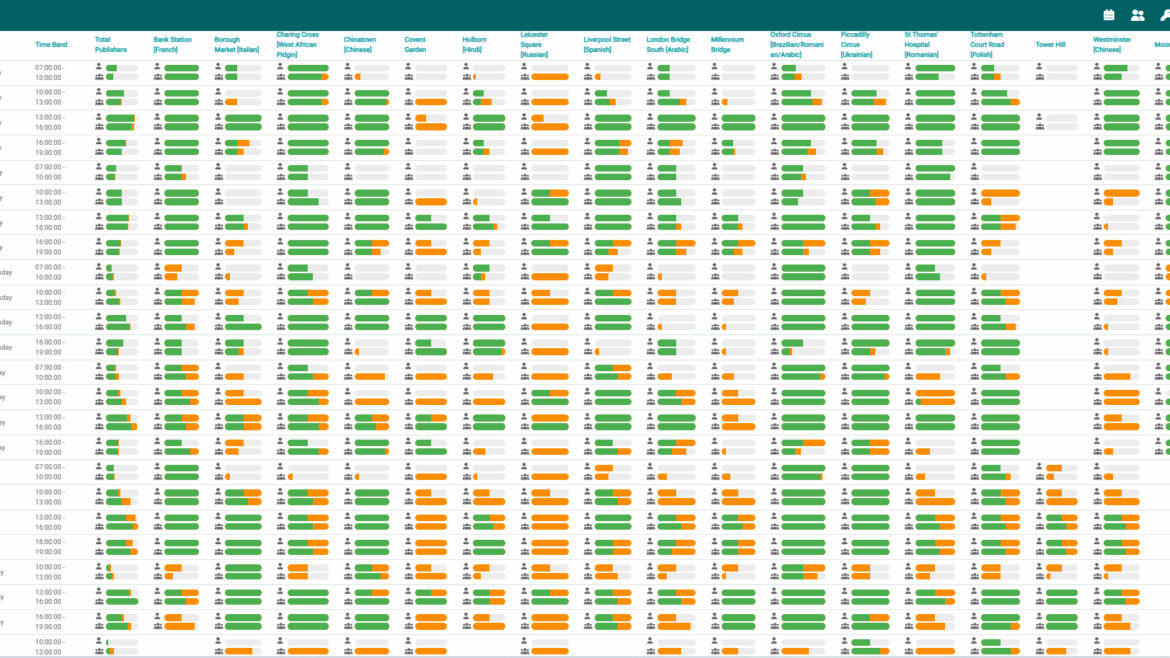
The LSM includes a feature called Current Needs, which offers three different views. These are shown to publishers and administrators according to their specific permissions.
One of these is the Statistical View. Like the other two views, it focuses on the next scheduling period set for your city — in London, this means the next 14 days.
In this view, each bar represents the number of publishers and captains needed for a specific location and shift time. The bar is divided into three parts:
- Full bar length → the total number needed
- Green section → those already assigned
- Orange section → those who are available but not yet assigned
For publishers, this gives a quick overview of the overall trend: which locations and times have the greatest need, and where they can apply most effectively.
For coordinating elders, the Statistical View is even more powerful. By looking at the graphs, they can identify days in the coming weeks where publishers are available but unscheduled, helping them make adjustments and achieve a better balance across shifts. It also highlights where schedulers may need additional support, reminders, or training.
Looking at the example picture attached:
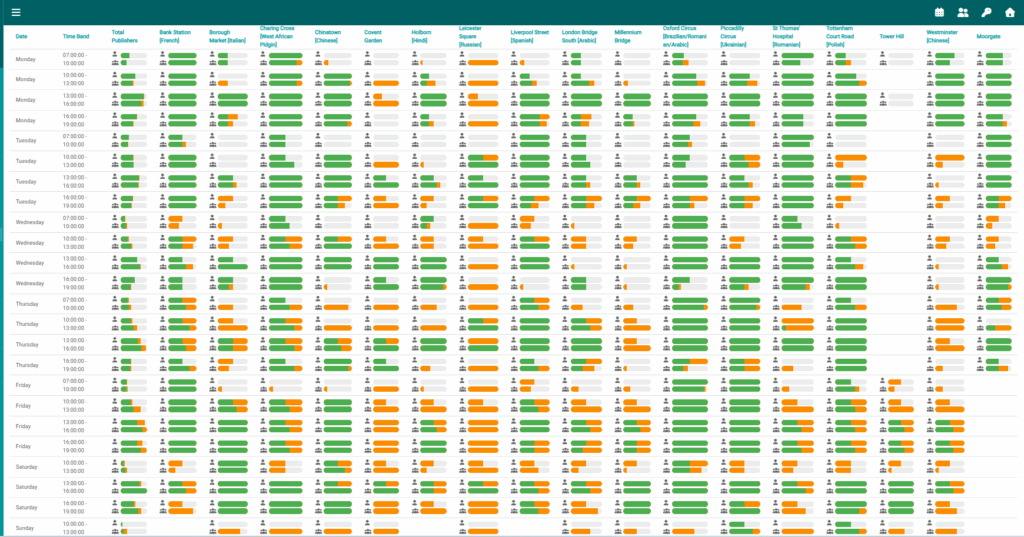
- For captains, it is evident that Friday morning (7–10 am) is the least supported, and captains could make themselves available to help. Likewise, Thursday morning at 10 am shows a significant need.
- Looking across the graph more broadly, coordinating brothers may also notice that Friday as a whole (7 am–7 pm) shows many available brothers and sisters not yet assigned. Since these shifts are already within the next two weeks, this indicates that the schedulers are struggling to keep up with assignments. This could point to a need for more training, reminders, or even counsel, depending on the underlying reasons.
The Statistical View therefore not only helps publishers see where they can serve, but also provides elders with a clear tool to ensure scheduling remains effective, balanced, and well supported.